I’ve recently been employed as a Research Assistant with the group I did my PhD with at the Menzies Institute for Medical Research (University of Tasmania, Hobart, TAS, Australia). My work is continuing on with genomics based analyses of inherited diseases including cancer (my thesis was based on a Tasmanian familial blood cancer resource, but we also study other cancers) and also now eye diseases.
Something I’m working on at the moment is how to keep a record of my day-to-day analyses when i’m working on different projects for different people. I was originally trained as a lab based scientist so for me this is a lab book equivalent. Somewhere I can record the processes I went through, ideas, relevant notes and output. I also want it as a living document that can be shared with my colleagues and supervisors. I’d like to be able to demarcate code, differentiating between R code and Unix commands and also be able to include plots with ease.
So i’ve been investigating a few different options, which is what this post is about:
Google Docs
My initial go-to was Google Documents. I can use different font styles there for Unix or R code, it’s easily shareable and collaborative with others, changes are trackable, and it’s stored online securely (for what I understand).
However it’s a little bit cumbersome copy / pasting from the terminal or an R script to the google document, and I won’t always necessarily have WiFi access when analysing data.
R Markdown
So my next port of call has been in RStudio using an R Markdown document. The idea here would be keep everything in the Markdown and regularly upload the PDF to With knitr this creates a PDF fairly quickly and I can still do demarcations of different code types. I’ve been using the standard demarcation for R code (which also runs the code during knitr) and tab indenting Unix commands and Unix output. A challenge I’ve hit is when I have a long unix command string without spaces or new lines, Markdown doesn’t wrap automatically. (I believe I can make a change to allow that). I also don’t always want or need it to run my R code when the PDF (or HTML or Word document) compiles, so I’d like to be able to demarcate that something is R code but not have it as active R code.
Other options?
I could achieve a similar thing to Markdown with LaTeX, which is many levels of more complicated above Markdown but would allow me to personalise my recordings and make the desired demarcations.
I’ve had a brief google around and found a few posts on the topic:
Which advocates for using a tiered type organisation. Project, Task, Steps. Record the details of the project, record the tasks in the project as you do them and then the steps within each task (including all data mangling).
I like this article, it brings together a lot of different conversations on this topic with opinions from an experienced Bioinformatician. The article also recommends a wiki or other online alternative / blog so that it can be accessed collaboratively.
Tentative conclusions
With that in mind I think what I’m going to aim for is the Google document approach. If I set up some styles it will be easy to change fonts for different types of code. It will mean copy/pasting notes and code around but I think that it’s the most useful approach for working accountably and collaboratively. I’ll keep looking into R Markdown as well, it might be useful to use that as a final resting place for what I place in the Google doc when part of a project is complete.
Given as a birthday gift by a friend last year I had put off reading this book until after I finished my PhD. The gift-giver has previously won on the book selection front when I was given Matt Ridley’s Genome a few years ago, so I was confident that this was going to be a winner.
Plus, Susan Cain, author of Quiet, another fantastic read, is quoted on the front cover with “The word ‘brilliant’ gets thrown around a lot, but it should be saved for Christine Kenneally”
This book was written for the general public, however even as a scientist with human genetics training I found it to be a fascinating read. It covered so many topics and issues faced in human genetics research but was particularly centred around the idea of how our genetic make up, the convergence of all our ancestral pairings, contributes to our idea of self, with a large focus on familial genetics (which is great because that’s my field)
Each chapter begins with a personal story or character of some description that is used as the narrative for the chapter. The author uses the personal stories of the people she’s interviewed to weave together high level genetic concepts with their direct application and implication in everyday life.
A recurring topic is the concept of genetic contribution to ancestry. Kenneally makes the clear distinction that ancestry and race are different. My understanding is that ancestry is the genetic history that lead to Individual X’s genome. This may have been combinations of ancestors from different countries and different gene pools across the world. Race instead is a social concept and has several more sinister implications as it has been used in the past to categorise people into levels, with some races being wrongly perceived to be superior to others. Direct-to-consumer genetic testing from companies such as 23andMe, amongst others, have made it very accessible for any individual to determine their genetic history and their ancestor’s origins.
We’re now at point with genetics that not only can we tell someone that they have Chinese, English or Irish ancestry, we can also given the right population study show the direct area of a country that an individual’s ancestors originated from, as has been shown with the fine-scale geomapping using the People of the British Islands study run by Peter Donnelly at the Wellcome Trust Centre for Human Genetics.
People of the British Isles circa the year 600. Source: Wikipedia.We can track the impact of key historical events within the genome. An example is the spread of the Mongol empire across Europe from which Genghis Khan’s (and son’s) prolific raping and pillaging has left a direct genetic imprint on humanity. By killing local males Khan made Mongol (and also specifically his genetics, traceable through Y-chromosome analyses) a dominant contribution to the area. Not only can we see history in the human genome, but also in the genomes of domesticated animals as migration and agricultural transfer between countries and cultures has also left it’s impact there.
Spread of the Khan empire. Source: Wikipedia.As a seventh or so generation Tasmanian, and a bioinformatician who works on Tasmanian families this book has peaked my interest in looking more into my own family history. What is my genetic background? Where did my Y-chromosome and mitochondrial DNA originate from? What sequence of events and ancestors lead to the eventual genetic combination that is me? Of course that’s all very self centred, but still, it’d be cool to find out.
Sometimes as geneticists we become myopic on our research area and frustrated by various challenges. Books like this make us consider genetics as a whole and the vast and wide-spreading impact of the research field we work in.
As a geneticist, one thing i’m aware of in reading this book is that many of the analyses Kenneally explains so well have been conducted using SNP arrays, analyses of common genetic variation in populations. While findings from these types of data are extremely valuable, we’re now in the era of whole genome sequencing, where we can examine not only common variation, but rare genetic variation, variation that’s present in less than 5% and less than 1% of the general population (or even private to a specific family). What new information resolution level this type of variation would add to the stories described in this book would be extremely interesting to know.
I bumped into an advertisement on Facebook from CSIRO for a live webcast launch of Aquaria on Tuesday 3rd February. I first heard about Aquaria last year at the ABiC conference (Australian Bioinformatics Conference) in a talk from Sean O’Donoghue and had put looking into the software onto my post-PhD todo list. So the webcast seemed a perfect opportunity to remind me what it’s all about.
The text from the launch page (which may not be active forever) said the following:
Aquaria is a new web resource for biologists that simplifies the process of gaining insight from protein structures. This event coincides with the publication of an announcement about Aquaria in Nature Methods.
A range of speakers will introduce Aquaria, describe how it works, and highlight how it can be used by biologists to gain insight into protein function.
Speakers include:
Dr. Seán O’Donoghue – CSIRO & Garvan Institute
Dr. Andrea Schafferhans – Technical University of Munich
Mr. Chris Hammang – Garvan Institute
Mr. Neil Jackson – Amazon
You can catch the YouTube clip of this event here.
Here’s my notes from the event
Italicised sentences are my own thoughts.
Seán O’Donoghue opened the event.
the Protein Data Bank (PDB) is not intuitive for biologists, requires specialised research skills to access and interpret
‘[with Aquaria] essentially what we’ve done is tried to reorganise this information in a way that is intuitive to biologists’
the relationship between protein sequence and a protein structure is not 1:1
there are multiple structures for a single sequence, whereby protein structural biologists have mutated different residues in order to obtain crystal structures, or have determined a structure for small parts of a protein
for example the p53 protein for Homo sapiens has 131 matching structures in the PDB
Aquaria is able to make an overview to see how all the matching structures for a protein overlap
an important feature is that any residue that is not equal to the sequence of interest is highlighted in black (eg. mutations that crystallographer has introduced to solve the sequence)
Aquaria has ‘google like simplicity’, you enter the protein name and species (eg p53, human)
by default Aquaria shows the structure that has the best match i.e. the largest number of identical sequences
Aquaria emphasises that for a particular protein sequence there are gaps where the structure is unknown
From my point of view, this is a challenge for geneticists, when we’re trying to determine whether a protein coding mutation has an effect on the function of the protein, and the structure of that particular part of the protein is unknown, we’re essentially blindfolded.
Aquaria also includes structural views where the protein of interest is bound to a macromolecule
It’s easy to zoom in and out and move the structure around, easy navigation
there is an annotated feature tab showing the specific roles or binding partners of parts of the protein
clicking on a feature track highlights the features in the structure view
One of the exciting benefits of Aquaria is that genetic variations resulting in an amino acid change, that are responsible for cancer can be mapped as a feature track. This enables the researcher to see the spatial clustering of mutations which may give new insight into mutation function. For example it is particularly interesting if mutations cluster in a single domain of the protein, indicating that loss or gain of function in that domain contributes to cancer development. Looking at the amino acid changes in a linear view may not reveal these relationships.
many proteins don’t have a protein structure available, but may have a similar sequence, for example GLUT4, a transport protein that lives in fat cells and is responsible for glucose uptake, does not have a determined protein structure
when the GLUT4 amino acid sequence is aligned onto GLUT1 amino acid sequence (for which the protein structure is known) there’s a high level of homology
this means that GLUT4 structure can be modelled on the GLUT1 structure (the closest matching structure for GLUT4) with a 68% sequence match and dark residues in Aquaria show where the GLUT4 protein differs from the GLUT1
I think a similar method would be possible with proteins where the structure of the mouse (or other non-human species) equivalent is known.
Aquaria doesn’t just determine best match to PDB but also ALL available matches, can be worthwhile looking at lower % matches, looking at different structures gives you information about different functional states of the protein, or of similar proteins
The second speaker was Andrea Schafferhans from Germany.
Andrea was key in the development of the database behind Aquaria
this data base is called PSSH2 (protein sequence-to-structure homologies 2) which builds upon the original PSSH database which takes information from UniProt/SwissProt protein sequences and the PDB to identify homologous structures (from what I understood)
PSSH2 is faster and uses a newer alignment method called HHblits which uses HMMs
not always easy to find the structure of a protein, only about 4% of the protein amino acid sequences in SwissProt have direct structural information
Aquaria’s features API (application programming interface) allows uploading of annotations into a track in the Aquaria view, allowing visualisation of mutations of interest on the protein structure
benefit of this is, is that in a linear protein sequence these mutations make not make a lot of sense but in the context of the 3D structure they do, eg. mutations cluster in the internal active site of protein
as at 01/2015 the PSSH2 database has 460,000 non-redundant SwissProt protein sequences, 72,000 non-redundant PDB chains and 48,460,000 alignments
with more than 100 alignments per protein this means around 11GB of alignment data
Seán O’Donoghue spoke again, highlighting the importance of the feature API.
the user defines features that they want to highlight into a JSON (JavaScript Open Notation) file and can map them onto any structure, this is a new feature, particularly important for Garvin researchers
I don’t have any experience with JSON files but I looked into the help information about the Feature API on the Aquaria website, they give a reasonable description about making the JSON file, for example for variants of interest in a particular protein. This feature is still under development. However given that a goal of Aquaria is to make protein information accessible to biologists I would like to see a simpler format taken up, for example CSV file or somehow converting a VCF file of genotypes.
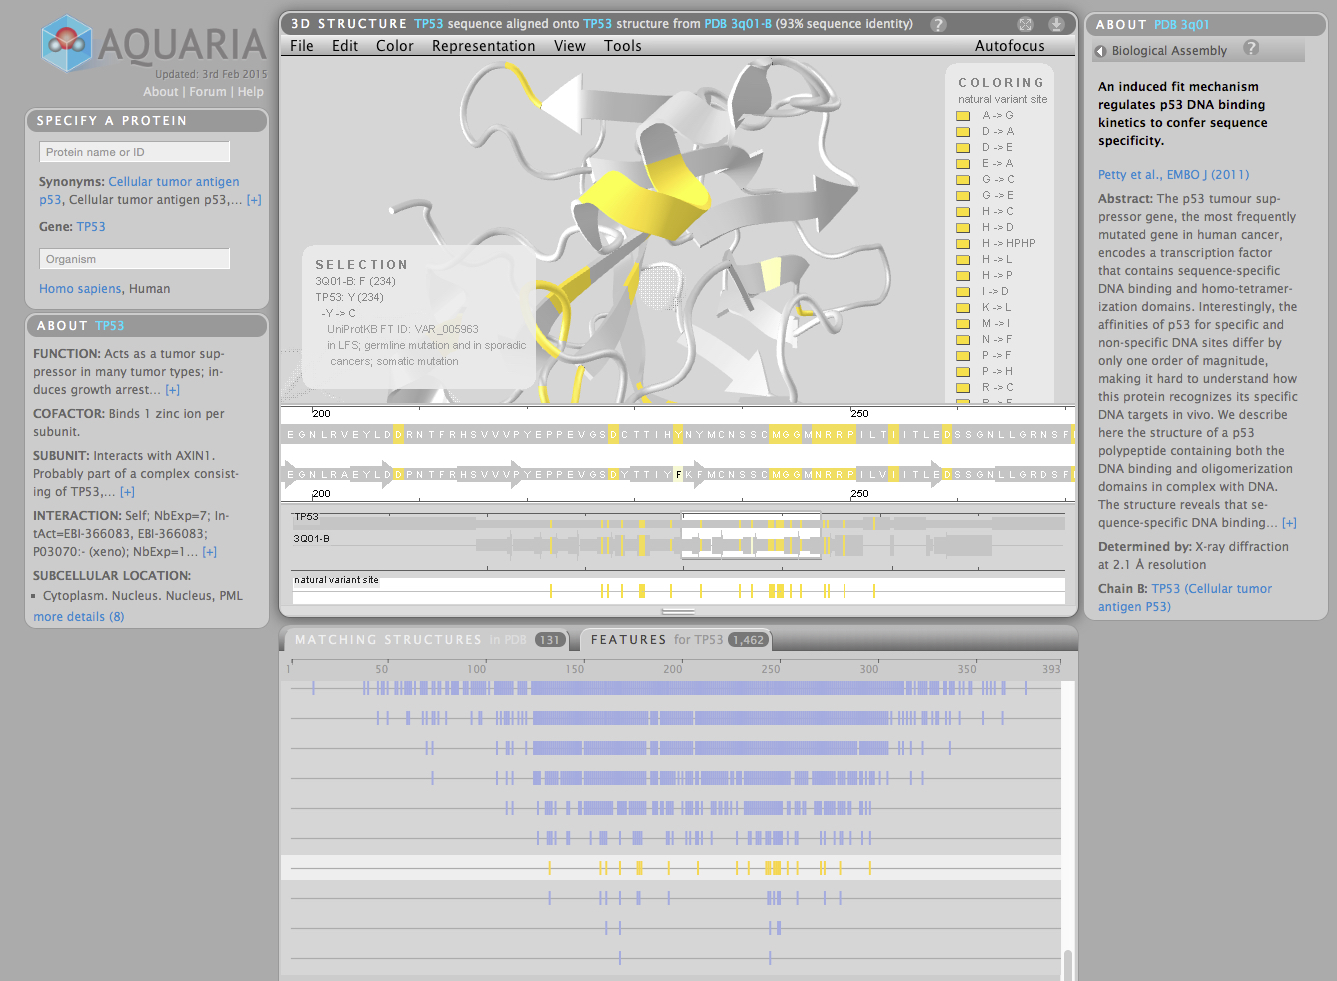
There are some sequence variation feature tracks from UniProt where you can highlight altered amino acid residues, but the information provided on each track is limited, i’m using TP53 as an example, so it’s hard to tell the context of the variants. See the screen grab below:
A screen grab from Aquaria showing the selection of one feature track of genetic variants from UniProt and the corresponding highlighted residues (yellow) in TP53.
Neil Jackson from Amazon spoke about hosting Aquaria
Amazon is honoured to be involved in supporting Aquaria
Amazon hopes that this is a resounding success for all scientists around the world
Amazon web services supports many big data projects such as the 1000 genomes project
they host the service and the underlying database
data is also accessible programatically
Chris Hammang from the CSIRO / Garvan Institute introduced a novel application of Aquaria in his Alzheimer’s Enigma animation. He just showed a brief sneak preview of the animation that was being released in the VizbiPlus event in Canberra with Australia’s Chief Scientist the following day. (you can see his animation and the others from that event here – they’re impressive). Chris is an animator who makes science videos for the general public. In this context he is using Aquaria for public outreach rather than scientific research.
Chris modelled the structure of the key protein implicated in Alzheimer’s Disease, APP. For his animation he wanted an overall model representation of APP, but the full structure has not been solved, just parts of it. To create a reasonable model Chris assembled all the structures he could find from Aquaria (many were fragments) and pieced them together for the animation. Particularly useful was the ability to use Aquaria’s feature track to identify what part of the protein is within the cell membrane, what is external and what is internal.
Seán O’Donoghue wrapped up the launch describing a bit of fun they’ve had with Aquaria in enabling compatibility with the Leap Motion, a sensor device that attaches to the computer and allows, in this context, hand gestures to rotate and navigate the protein structure.
Seán gave a few final practical notes:
Aquaria runs best on Firefox on Windows / Linux and Safari or Firefox on Mac
Chrome has limited functionality
moving towards javascript for the molecular viewer part which means Chrome compatibility
Aquaria help – there is a help button, they’ve gone to effort to make the help useful, it’s an overlay on the main screen
There’s a PDF 1 page summary for controlling aquaria
The Feature API and be used for pulling data from Aquaria, adding on data to Aquaria
Seán said that they would be hosting a Reddit ‘As me anything’ in a few weeks, the details will be on the Aquaria launch page.
I ran Aquaria in Mac OS X 10.10.2, Safari 8.0.3, it’s a Java application so you need that installed to run. I was prompted to install Java3D and there was an easy to use AquariaSetupMac.dmg that was able to be downloaded (browser restart required). Aquaria worked fine once all this was installed but when I went back to it the following day (I typically leave Safari open and my Mac on or sleeping) I had to reboot Safari to get it working again as there was a problem loading the protein structure.
All in all I am impressed with Aquaria and I think there is a lot of potential in the future for use in research. Previously to examine the effects of residue changes on a protein I was using Project HOPE (Have yOur Protein Explained) from the Netherlands Bioinformatics Centre. This is a web-based application that allows you to input an amino acid sequence of a protein of interest, select the altered residue and then the program will search for structural domains in the protein sequence. If a structure is known (or can be modelled on homologous structures) the program will predict the effect of the residue change you’ve input in terms of amino acid properties, conservation etc.
While Aquaria does not do this per se there are overlapping features between the two and I particularly like this idea of mapping all known disease-causing mutations (and those you want to query) in a protein to see whether they occur in a particular cluster in the 3D structure of the protein.